[Archive] LLDB — A debugger powered by LLVM.
There was a brief introduction to LLDB before, mainly covering some efficient breakpoint methods that Xcode already provides (symbolic breakpoints, objc-exception breakpoints, etc.) and concepts like image.
To learn LLDB, you should first understand the structure of LLVM:
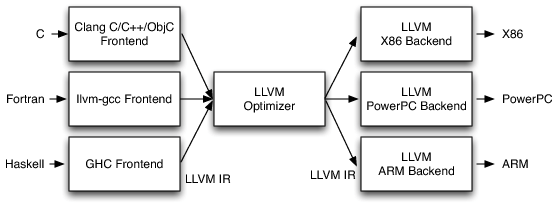
LLVM IR is a complete code representation. It is also the only interface to the LLVM Optimizer, so the LLVM frontend is essentially equivalent to what LLVM IR is, how LLVM IR works, and the rules of LLVM IR.
LLVM is a collection of libraries. Unlike GCC (one monolithic thing) or the JVM / .NET (opaque), LLVM is designed as a collection of libraries, which lets us build new tools using its rich interfaces.
LLDB is essentially a project that sits on top of LLVM. It uses LLVM IR (Clang) as a parser to interpret commands, LLVM JIT to convert to target code, and LLVM disassembler / LLVM Target to handle calling conventions.
Color notes:
Red: killer feature
Yellow: useful feature
Green: feature to be evaluated
Frame
The concept of a frame:
Frame info: view information about the current frame — frame info
Frame recognizer: recognizer is a concept LLDB uses to support external Python APIs.
Frame select: switch the current frame within the stack — frame select 0
For example, suppose we have a 100-level nested NSDictionary where every level has a different key, and we have a recursive traversal method. If we want to stop at [key equalTo:@"1234"] and obtain the level the key sits at, we can add frame select commands to a breakpoint to automate the recursive walk back.
Frame variable: many parameters, mainly used to format strings, etc.
-s annotates whether the variable is local, arg, or global.
-P the recursive description depth for the current frame's variables.
Thread: [th]
Backtrace: get the current stack of a thread — i.e. a stack of frames.
thread backtrace 3 gets thread 3's stack.
If the backtrace is truncated or nothing useful is captured, try the -e option.
Continue: continue a specified thread; without an explicit thread, all threads continue by default.
Thread continue 1 — resume the main thread.
Thread continue 1 3 — resume the main thread and thread 3.
Exception: …
Info: …
Jump: set the PC register to a new address.
List: briefly list the state of each thread.
plan: …
Return: immediately return from the current frame, optionally yielding a return value.
return [-x] -- [<expr>]: return an innermost expression evaluation.
return [<expr>]: return a return value.
Select: switch the currently selected thread.
Step-in: Alias: s
Step-over: Alias: n
Step-inst: instruction-level single step. Alias: si
Step-inst-over: stepping over calls. Alias: ni
Step-out: finish executing the current stack frame and stop after returning. Alias: finish
Step-scripted: custom stepping.
Until: run until reaching a given address or line.
Expression
The Expr command makes LLDB behave like an interactive command tool. We can use Expr to JIT-compile a piece of code and execute it. expr source code
Expr (int) printf("1234")
Expr unsigned int $foo = 5
Expr -o -- [NSObject new]
Po [NSObject new]
Expr -d 1 -- <expression> — print the dynamic type of the result of an expression.
Expr -i 0 -- function_with_a_breakpoint() — calling a function so you can stop at a breakpoint in the function. (I recommend giving yourself an alias for this; mine is call_withbr.)
Expr --: Alias: Print
Memory
Find: find a value at some address in the current process.
History: given an address, print all alloc/dealloc events recorded on that address in the current stack trace.
Read: read the value at memory.
Region: read the region info that contains a given address.
Write: write memory directly.
Register
Register read
Register read --all
Register write
Register write pc `$pc+8`
Disassemble
Translate to assembly.
Disassemble --frame: translate the current frame to assembly.
When investigating a frameBuffer memory leak issue after enabling -Oz, the experts probably used this method to inspect the assembly. Otherwise the signal-to-noise of disassembling a full file is too low.
disassemble --frame --mixed: mix assembly with the high-level language.
disassemble --frame --bytes: also print the machine code.
Bugreport: [bu]
Provides detailed information about the current stack. Fairly redundant — usually the call stack is enough. Bugreport mainly recursively expands the assembly for each layer of the call stack (using image show-unwind --address xxxxxxxxxxx).
Language: [la]
language objc class-table dump -v 'UIButton' — this is the only one I have found useful for reverse-engineering. System library symbols can be Googled directly; people specialize in dumping Apple's libs.
Process: [pr]
Usually Xcode → Debug → Attach is enough.
Target
Target commands are mainly used to resolve symbols.
For a dynamic library (a framework on iOS, a dylib on macOS), there is a rebase step at load time, but a symbol's offset inside the library does not change. In theory, as long as we rebase a dylib to the right address, we can recover the source location for a crash address in a crashLog.
LLDB lets us look up code locations by offset.
Suppose we have a crashLog with three dylibs. The crashLog has Binary Images like:
0x100000000 - 0x100000ff7 <A866975B-CA1E-3649-98D0-6C5FAA444ECF> /tmp/a.out
0x7fff83f32000 - 0x7fff83ffefe7 <8CBCF9B9-EBB7-365E-A3FF-2F3850763C6B> /usr/lib/system/libsystem_c.dylib
0x7fff883db000 - 0x7fff883e3ff7 <62AA0B84-188A-348B-8F9E-3E2DB08DB93C> /usr/lib/system/libsystem_dnssd.dylib
0x7fff8c0dc000 - 0x7fff8c0f7ff7 <C0535565-35D1-31A7-A744-63D9F10F12A4> /usr/lib/system/libsystem_kernel.dylib
libsystem_c.dylib's base is 0x7fff83f32000, the rest similarly.
How do we map 0x10000ff7 back to source?
(lldb) target create --no-dependents --arch x86_64 /tmp/a.out
(lldb) target modules add /usr/lib/system/libsystem_c.dylib
(lldb) target modules add /usr/lib/system/libsystem_dnssd.dylib
(lldb) target modules add /usr/lib/system/libsystem_kernel.dylib
First create the target with a.out and add the three dylibs.
(lldb) target modules load --file a.out 0x100000000
(lldb) target modules load --file libsystem_c.dylib 0x7fff83f32000
(lldb) target modules load --file libsystem_dnssd.dylib 0x7fff883db000
(lldb) target modules load --file libsystem_kernel.dylib 0x7fff8c0dc000
Use target modules load to simulate the rebase the program would do at startup.
(lldb) image lookup -a 0x00007fff8a1e6d46
(lldb) image lookup -a 0x00007fff84597df0
(lldb) image lookup -a 0x00007fff84598e2a
(lldb) image lookup -a 0x0000000100000f46
Done.
Bonus: Understanding how to use dSYM to resolve a crash stack.
Watchpoint
A breakpoint that triggers on an address.
This is honestly fantastic — I think the zombie detector uses a similar trick.
I see two main uses for address-based breakpoints:
Verify whether a system API or stack-variable mutation you called actually took effect — see example 1.
Example 1:
// Code that sets the system StatusBar.
// But I hit a case where setting it had no effect.
// Step into the assembly.
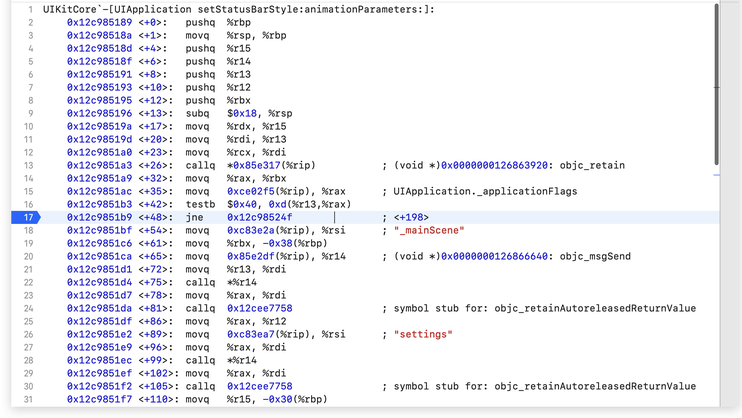
// There is a testb and jne here.
// Sure enough, it jumps away and does nothing.
// Without looking at assembly:
// If you're using a library, you can grab a variable's address but you can't see the source code — only the API. When the behavior doesn't match expectations, a good tool is:
watchpoint set expression 0xabcdef123 // the trailing value is a system address.
// Watching the address doesn't require reading assembly; if the value changes, the watchpoint will catch it.
Example 2:
NSArray<MyModel *> *myModels = [NSArray arrayWithDictionarys:data];
// Build an array from the dicts the backend returned; each element is one of our models.
// …
// After a bunch of binary-linked libraries do their thing, or after calling someone else's API…
// myModels is gone.
If you don't want to step through every layer to find who clobbered your models, a simple, effective option is to add a watchpoint on the address of myModel.
Breakpoint: [br]
A breakpoint that triggers on a method.
Breakpoint set --name main: Alias: br s -n main
--file test.c --line 12: Alias: br s -f test.c -l 12
--method main: Alias: br s -m main. C++ only.
--name "[NSString stringWithFormat:]" — set a symbolic breakpoint by name.
--selector <selector-name> — set a symbolic breakpoint by selector.
--condition: set a breakpoint condition.
-E <source-language>: -E objc sets an objc exception breakpoint; objc can be replaced by c, etc.
-F <full-name>: in C++ this is namespace + all parameters; in objc, a full function prototype with class and selector.
-t <thread-id>: the breakpoint stops only for the thread whose TID matches.
-s <shlib-name>: set the symbolic breakpoint only on the specified dynamic library.
-r <regular-expression>: use a regex breakpoint, e.g. br s -r cellforitem.
Breakpoint command:
Add <index of breakpoint>: breakpoint add 2 — attach stop-time instructions to breakpoint #2.
Breakpoint modify:
-G: auto-continue.
-T <thread-name>: breakpoint stops only for the thread whose name matches.
-q <queue-name>: breakpoint stops only for threads in the given queue.
Image: [im]
Image list: list the main executable and all dependent shared libraries.
Image lookup --address: look up info by address.
Image lookup -r -n <runc_regex>: regex lookup of debug symbols.
Image lookup -r -s <runc_regex>: regex lookup of non-debug symbols.
Image lookup --type <some type>: look up info by type name.
(lldb) im loo --type xxCell — best match found in /Users/folobe/Library/Developer/Xcode/DerivedData/xxxxxx
Image dump section <module-name>: dump a module.
Image dump symtab: dump all symbols from the main executable and all shared libraries.
Command
Command alias: create an alias. To persist it (like zsh), create ~/.lldbinit and write command alias alias-name <raw-input>.
Chisel plugin
Slowanim <multiple factor>: globally speed up or slow down animations; also works on Lottie sequence-frame animations.
Alias for: expr [(CALayer *)[[[[UIApplication sharedApplication] windows] objectAtIndex:0] layer] setSpeed:(CGFloat)%s]
Visualize: render an image from an address — equivalent to Xcode's preview.
Visualize (CALayer *)
Visualize (UIImage *)
Visualize (UIView *)
Using structs like CGRect in LLDB: _tvFeed setFrame:(CGRect){0, 0, 320, 300}